Courier Service Fleet Reduces Downtime by 25%
1. Overview
Pitstop provided a large Heavy and Medium-duty logistics fleet with a comprehensive fleet maintenance solution including predictive analytics. The intention was to help the fleet reduce downtime for the 150+ heavy-duty assets on hand.
Summary of Findings:
- Average annual savings of $613 per vehicle reducing downtime by 25%.
- Return on investment (ROI) with Pitstop’s predictive analytics of 1025%, providing $133,000 in savings.
- 26% of the fleet population performed 4x worse than the average. For the poor-performing vehicles, Pitstop could show annual savings of $2000 per vehicle which is 48+ hours of downtime per vehicle.
- Weekly fleet maintenance report that provided actionable insights for the fleet manager.
- Vehicle rankings are based on objective data to decide which vehicles’ leases should be discontinued.
2. Problem Statement/What Pitstop Solved
This fleet has 150+ Class 7 and 8 vehicles equipped with telematics. However, even with telematics investment, there is a gap in taking advantage of the data to streamline fleet maintenance operations.
| No Summary of Fleet Health |
The fleet did not have a tool to understand what was wrong with their fleet. Fleet Manager Allan has noted how he only has relatively “little time to look at details,” and desires a simple way to showcase this data. The solution was a simple dashboard that quickly shows which assets need attention.
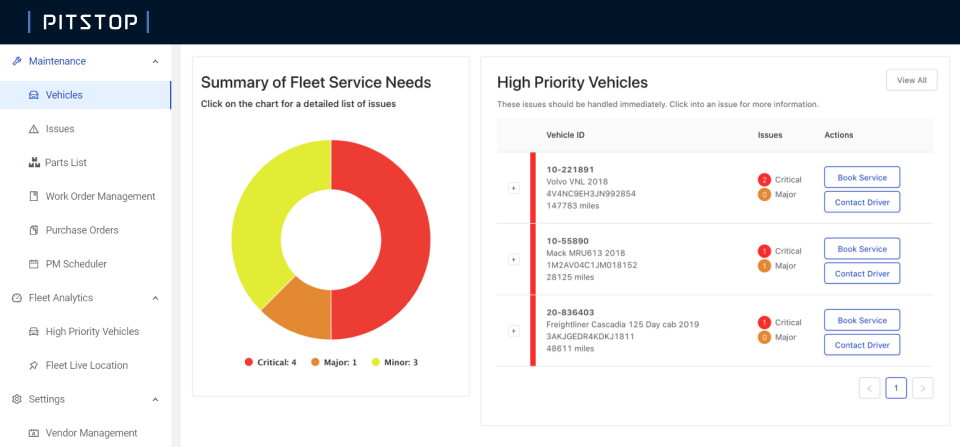
Figure 1. A dashboard showing a summary of fleet service needs
| No Service Priorities |
This fleet brings their vehicles in for service in a reactive manner. Currently PM schedules are logged in Excel, any real-time issues are up to the driver to communicate with the fleet manager and unexpected issues lead to breakdowns. As Allan describes it, “My week is full of chaos.”
The solution was an overview of each vehicle’s breakdown reasons and details on critical major and minor fleet maintenance issues.
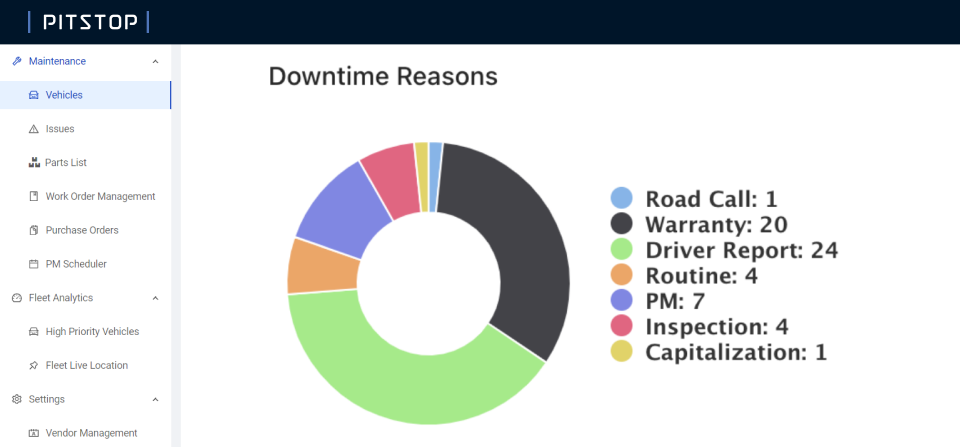
Figure 2. A Summary of Downtime Reasons
| Vehicle Degradation |
Fleet needed to understand which vehicle is good or bad other than simply remembering which vehicles tend to give troubles. By creating a score for each vehicle, important leasing decisions can be made to ensure future and long-term savings.
The solution was a vehicle ranking system, that provides an objective score comparing all vehicles in the fleet against each other. This enables a fleet manager to understand the bottom 10% instantaneously and in real time.
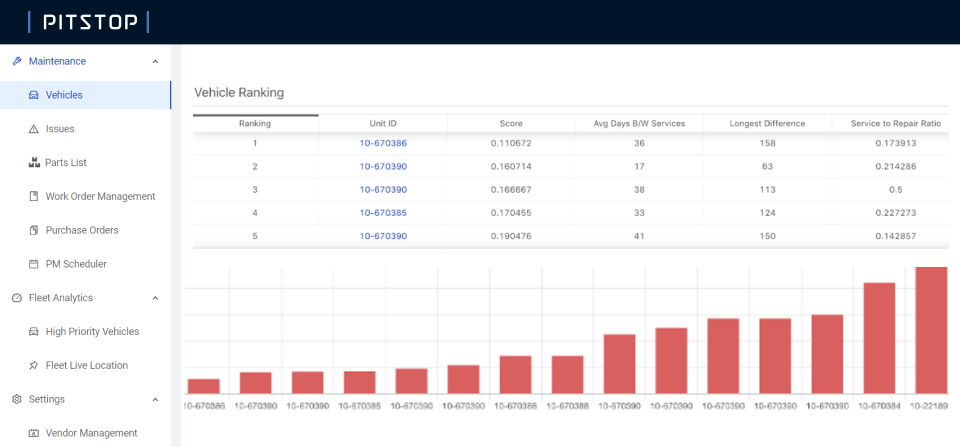
Figure 3. A Dashboard Showing Vehicle Rankings
3. Return on Investment
In a relatively short amount of time, Pitstop’s predictive algorithms and analytics were able to detect the following:
- Faulty Clutch Actuator(s) – The fleet manager emphasized how the trucks would have been found on the side of the road, awaiting a $1000+ towing cost plus late delivery consequences.
- Predicting Battery Failure – Pitstop was able to showcase potential failures, allowing the fleet to be ready with a replacement and coordinate dispatch more effectively; thus saving time in loading and roadside assistance, and saving costs of a roadside mechanic.
- Optimized Service Visits– keeping the vehicle out of the shop is critical. By organizing and prioritizing repair and scheduling fleet maintenance, the fleet can be more efficient, drastically reducing downtime.
- Asset Lease Return – a comprehensive list based on data of which vehicles to turn over to reduce the average Total Cost of Ownership.
| Return on Investment Calculation |
26% of vehicles in the fleet fall under the category of Poor Performance due to the operational downtime of the fleet. 46% are classified as Average and 28% as Excellent.
Poor Performance as per Pitstops definition is 4x greater downtime than the Average. From the algorithms, Pitstop was able to group minor services, reduce catastrophic events around specific subsystem failures (ex. battery), and reduce the average number of visits to a service center for these bad vehicles.
The combination of these changes reduced the poor-performing vehicles’ downtime to the fleet’s average downtime.
This resulted in an overall fleet savings of $46,032 at a savings just for the poor-performing vehicles. The savings for increasing the uptime for the average and excellent-performing vehicles was $86,968. The outcome for the Fleet concluded to provide 10X (1025%) the investment into the Pitstop solution.
4. Outcome
The Fleet Manager had various positive things to say about Pitstop. He claimed that with the power of one click, he could see in real time the health of his fleet. His day-to-day activities shifted from chaotic and reactive to planned and predictive. Communication is made easier and the problem can be narrowed down to a granular level.
With Pitstop, the fleet was able to discover and act upon various returns on investment (ROI) of 10X based on reducing costs, downtime and having insights before the vehicle hits the repair shop.